Welcome to the Network Engineering Domain
Pape O. Fall's Blog

Ethanalyzer – NX-OS Protocol Analyzer

Ethanalyzer is a NX-OS protocol analyzer tool based on Wireshark. Wireshark is an open source analyzer that decodes packets captured by libpcap (Capture Library). Cisco NX−OS runs on top of the Linux kernel, which uses the libpcap library to support packet capture. The Ethanalzyer is a command-line version of Wireshark that captures and decodes packets, and can be used to troubleshoot the network and analyze control-plane traffic. The Ethanalyzer uses the same capture file syntax as tcpdump. More information on tcpdump can be found at http://www.tcpdump.org/tcpdump_man.html

Think of it as Wireshark baked into NX-OS. No external sniffer is needed here and we can capture packets Rx/Tx CPU. We can also use Ethanalyzer with ACLs to capture data-plane packets. This is the topology we will be working with today.


Here, we have daisy-chained three N9Ks and each N9K has a loopback address per the diagram above.

Ethanalyzer is defined in 3 steps:

  • Step 1. Define capture interface.
  • Step 2. Define Filters: Set the capture filter or display filter.
  • Step 3. Define the stop criteria.

We have basically two kinds of filters that can be used here: capture filter & display filter

  • Capture filter: Only frames that matches the filer are captured
  • Display filter: Display packets matching filters from the captured set of packets

Note that by default, Ethanalyzer captures only up to 10 frames. This value can be increased by setting the limit-captured-frames option where 0 = No limit.

To start a capture, all we’d need is the following command:

ethanalyzer local interface[inband | mgmtoptions, with the following options:

  • Autostop: Capture autostop condition
  • capture-filter: Filter on Ethanalyzer capture
  • capture-ring-buffer: Capture ring buffer option
  • decode-internal: Include internal system header decoding
  • detail: Display detailed protocol information
  • display-filter: Display filter on frames captured
  • limit-captured-frames: Indicates the maximum number of frames to be captured
  • limit-frame-size: Capture only a subset of a frame
  • write: Identifies the filename to save capture to

See below specific commands:

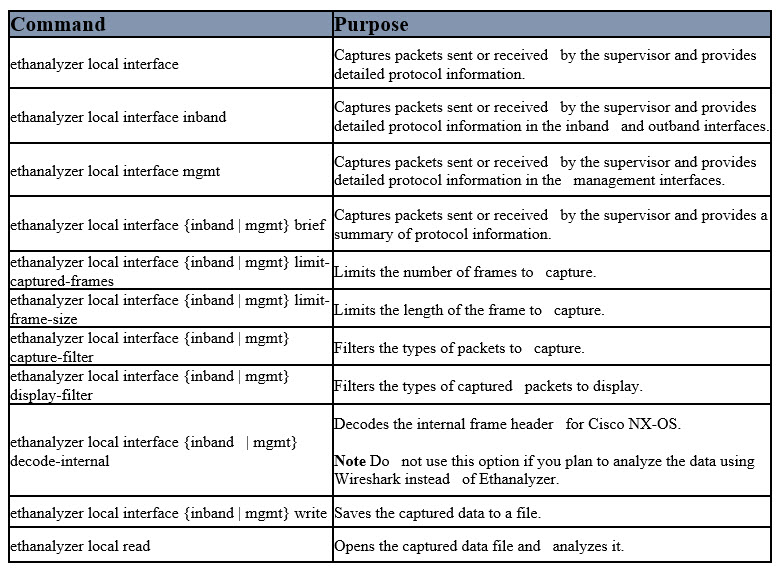
Let’s now dive into the CLI.

N9K1# ethanalyzer local interface inband 

Capturing on inband
2019-02-27 21:35:57.910119     12.1.1.2 -> 224.0.0.10   EIGRP Hello
2019-02-27 21:36:02.738910     12.1.1.2 -> 224.0.0.10   EIGRP Hello
2019-02-27 21:36:07.134710     12.1.1.2 -> 224.0.0.10   EIGRP Hello
2019-02-27 21:36:11.961370     12.1.1.2 -> 224.0.0.10   EIGRP Hello

4 packets captured
N9K1#

Here, the capture is displaying the control-plane traffic between N9K1 and N9K2 in reference to EIGRP adjacency. These are the hello messages in order to maintain the peering up. Let’s send ICMP requests from N9K3 to the Loopback address of N9K1 and see what we get.

N9K1# ethanalyzer local interface inband 

Capturing on inband
2019-02-27 21:38:25.264480     23.1.1.3 -> 1.1.1.1      ICMP Echo (ping) request
2019-02-27 21:38:25.273255     23.1.1.3 -> 1.1.1.1      ICMP Echo (ping) request
2019-02-27 21:38:25.282150     23.1.1.3 -> 1.1.1.1      ICMP Echo (ping) request
2019-02-27 21:38:25.292108     23.1.1.3 -> 1.1.1.1      ICMP Echo (ping) request
2019-02-27 21:38:25.298650     23.1.1.3 -> 1.1.1.1      ICMP Echo (ping) request
2019-02-27 21:38:25.306597     23.1.1.3 -> 1.1.1.1      ICMP Echo (ping) request
10 packets captured
2019-02-27 21:38:25.324161     23.1.1.3 -> 1.1.1.1      ICMP Echo (ping) request
2019-02-27 21:38:25.333659     23.1.1.3 -> 1.1.1.1      ICMP Echo (ping) request
2019-02-27 21:38:25.343149     23.1.1.3 -> 1.1.1.1      ICMP Echo (ping) request
2019-02-27 21:38:25.353865     23.1.1.3 -> 1.1.1.1      ICMP Echo (ping) request

Here, we can see the ICMP echo request coming from N9K3.

N9K2# ethanalyzer local interface inband 

Capturing on inband
2019-02-27 21:51:02.275811     23.1.1.3 -> 1.1.1.1      ICMP Echo (ping) request
2019-02-27 21:51:02.278612      1.1.1.1 -> 23.1.1.3     ICMP Echo (ping) reply
2019-02-27 21:51:02.288418     23.1.1.3 -> 1.1.1.1      ICMP Echo (ping) request
2019-02-27 21:51:02.290995      1.1.1.1 -> 23.1.1.3     ICMP Echo (ping) reply
2019-02-27 21:51:02.298914     23.1.1.3 -> 1.1.1.1      ICMP Echo (ping) request
2019-02-27 21:51:02.301344      1.1.1.1 -> 23.1.1.3     ICMP Echo (ping) reply
2019-02-27 21:51:02.309598     23.1.1.3 -> 1.1.1.1      ICMP Echo (ping) request
2019-02-27 21:51:02.312443      1.1.1.1 -> 23.1.1.3     ICMP Echo (ping) reply
2019-02-27 21:51:02.320412     23.1.1.3 -> 1.1.1.1      ICMP Echo (ping) request
2019-02-27 21:51:02.322833      1.1.1.1 -> 23.1.1.3     ICMP Echo (ping) reply
10 packets captured

Here from N9K2, we can see the bidirectional communication between N9K1 and N9K3. Let’s see here if we can SSH from N9K3 to N9K1 and filter our capture to on match on TCP/22.

N9K2# ethanalyzer local interface inband capture-filter "tcp port 22" limit-captured-frames 3

Capturing on inband
2019-02-27 22:48:05.750939     23.1.1.3 -> 12.1.1.1     TCP 58490 > ssh [SYN] Seq=0 Win=16384 Len=0 MSS=536 WS=0 TSV=156543 TSER=0
2019-02-27 22:48:05.754568     12.1.1.1 -> 23.1.1.3     TCP ssh > 58490 [SYN, ACK] Seq=0 Ack=1 Win=16768 Len=0 MSS=536 TSV=154936 TSER=156543
2019-02-27 22:48:05.757978     23.1.1.3 -> 12.1.1.1     TCP 58490 > ssh [ACK] Seq=1 Ack=1 Win=16768 Len=0 TSV=156543 TSER=154936
3 packets captured

Here, we can see the TCP 3 way handshake taking place and we can also see the source/destination IP/Ports. Note that the command “limit-captured-frames 3” limits the output of the capture to 3 packets and the “capture-filter “tcp port 22″” zero in on SSH traffic.

Let’s create a filter on N9K2 to only match on traffic sourced or destined to N9K3 loopback address (3.3.3.3/32) and see what we get.

N9K2# ethanalyzer local interface inband capture-filter "host 3.3.3.3" limit-captured-frames 5

Here we’re limiting the capture to display traces matching on host 3.3.3.3. Let’s now ping the Loopback of N9K1 and source it from N9K3 Loopback.

N9K3# ping 1.1.1.1 source 3.3.3.3
PING 1.1.1.1 (1.1.1.1) from 3.3.3.3: 56 data bytes
64 bytes from 1.1.1.1: icmp_seq=0 ttl=253 time=21.251 ms
64 bytes from 1.1.1.1: icmp_seq=1 ttl=253 time=10.556 ms
64 bytes from 1.1.1.1: icmp_seq=2 ttl=253 time=41.125 ms
64 bytes from 1.1.1.1: icmp_seq=3 ttl=253 time=9.746 ms
64 bytes from 1.1.1.1: icmp_seq=4 ttl=253 time=13.613 ms

--- 1.1.1.1 ping statistics ---
5 packets transmitted, 5 packets received, 0.00% packet loss
round-trip min/avg/max = 9.746/19.258/41.125 ms
N9K2# ethanalyzer local interface inband capture-filter "host 3.3.3.3" limit-captured-frames 5

Capturing on inband
2019-02-27 22:55:27.070940      3.3.3.3 -> 1.1.1.1      ICMP Echo (ping) request
2019-02-27 22:55:27.080890      1.1.1.1 -> 3.3.3.3      ICMP Echo (ping) reply
2019-02-27 22:55:27.094008      3.3.3.3 -> 1.1.1.1      ICMP Echo (ping) request
2019-02-27 22:55:27.097307      1.1.1.1 -> 3.3.3.3      ICMP Echo (ping) reply
2019-02-27 22:55:27.103331      3.3.3.3 -> 1.1.1.1      ICMP Echo (ping) request
5 packets captured

Very well ! Here we can see that our filters works and we’re only seeing traffic matching on host 3.3.3.3.

We also have the ability to write our capture to bootflash. The pcap file can be then read directly from the cli or transferred via FTP, TFTP, SCP, SFTP or USB to a remote server where it can be analyzed via Wireshark.

Let’s write a capture to bootflash.

N9K2# ethanalyzer local interface inband capture-filter "host 23.1.1.3" write bootflash:routeleak.pcap

Capturing on inband
10

Here, we’ve saved our capture under a file name “routeleak.pcap”. Let’s see if we can read the file.

N9K2# ethanalyzer local read bootflash:routeleak.pcap

2019-02-27 23:23:01.056331     23.1.1.3 -> 224.0.0.10   EIGRP Hello
2019-02-27 23:23:04.704857     23.1.1.3 -> 12.1.1.1     TCP 59096 > ssh [SYN] Seq=0 Win=16384 Len=0 MSS=536 WS=0 TSV=177278 TSER=0
2019-02-27 23:23:04.708519     12.1.1.1 -> 23.1.1.3     TCP ssh > 59096 [SYN, ACK] Seq=0 Ack=1 Win=16768 Len=0 MSS=536 TSV=175413 TSER=177278
2019-02-27 23:23:04.712118     23.1.1.3 -> 12.1.1.1     TCP 59096 > ssh [ACK] Seq=1 Ack=1 Win=16768 Len=0 TSV=177279 TSER=175413
2019-02-27 23:23:04.713518     23.1.1.3 -> 12.1.1.1     SSH Client Protocol: SSH-2.0-OpenSSH_6.2 PKIX\r
2019-02-27 23:23:04.776167     12.1.1.1 -> 23.1.1.3     SSHv2 Server Protocol: SSH-2.0-OpenSSH_6.2 PKIX FIPS\r
2019-02-27 23:23:04.900333     12.1.1.1 -> 23.1.1.3     TCP [TCP ACKed lost segment] [TCP Previous segment lost] ssh > 59096 [ACK] Seq=424 Ack=931 Win=16768 Len=0 TSV=175415 TSER=177279
2019-02-27 23:23:04.923644     23.1.1.3 -> 12.1.1.1     SSHv2 [TCP ACKed lost segment] [TCP Previous segment lost] Client: New Keys[Malformed Packet]
2019-02-27 23:23:05.032474     12.1.1.1 -> 23.1.1.3     TCP ssh > 59096 [ACK] Seq=824 Ack=1027 Win=16768 Len=0 TSV=175417 TSER=177281
2019-02-27 23:23:05.190417     23.1.1.3 -> 12.1.1.1     TCP [TCP ACKed lost segment] [TCP Previous segment lost] 59096 > ssh [ACK] Seq=1247 Ack=1096 Win=16768 Len=0 TSV=177283 TSER=175417

Note here that we can clearly read the pcap file saved in bootflash. Also, in order to get more valuable information, we can add the keyword “detail” at the end which would display information starting from L1 (Physical Layer) up to the L4 (Transmission Control Layer). Lets run the same trace but limit it to a single packet and show what it looks like.

N9K2# ethanalyzer local interface inband capture-filter "host 23.1.1.3" limit-captured-frames 1 write bootflash:routeleak.pcap

Capturing on inband
1

All right, this is what the command looks like. I’m going to SSH from N9K3 to N9K1 and check the tracefile with the “detail” command.

N9K2# ethanalyzer local read bootflash:routeleak.pcap detail

Frame 1 (74 bytes on wire, 74 bytes captured)
    Arrival Time: Feb 27, 2019 23:35:21.930886000
    [Time delta from previous captured frame: 0.000000000 seconds]
    [Time delta from previous displayed frame: 0.000000000 seconds]
    [Time since reference or first frame: 0.000000000 seconds]
    Frame Number: 1
    Frame Length: 74 bytes
    Capture Length: 74 bytes
    [Frame is marked: False]
    [Protocols in frame: eth:ip:tcp]
Ethernet II, Src: 50:00:00:03:00:07 (50:00:00:03:00:07), Dst: 50:00:00:02:00:07 
(50:00:00:02:00:07)
    Destination: 50:00:00:02:00:07 (50:00:00:02:00:07)
        Address: 50:00:00:02:00:07 (50:00:00:02:00:07)
        .... ...0 .... .... .... .... = IG bit: Individual address (unicast)
        .... ..0. .... .... .... .... = LG bit: Globally unique address (factory
 default)
    Source: 50:00:00:03:00:07 (50:00:00:03:00:07)
        Address: 50:00:00:03:00:07 (50:00:00:03:00:07)
        .... ...0 .... .... .... .... = IG bit: Individual address (unicast)
        .... ..0. .... .... .... .... = LG bit: Globally unique address (factory
 default)
    Type: IP (0x0800)
Internet Protocol, Src: 23.1.1.3 (23.1.1.3), Dst: 12.1.1.1 (12.1.1.1)
    Version: 4
    Header length: 20 bytes
    Differentiated Services Field: 0x00 (DSCP 0x00: Default; ECN: 0x00)
        0000 00.. = Differentiated Services Codepoint: Default (0x00)
        .... ..0. = ECN-Capable Transport (ECT): 0
        .... ...0 = ECN-CE: 0
    Total Length: 60
    Identification: 0xe0d1 (57553)
    Flags: 0x00
        0.. = Reserved bit: Not Set
        .0. = Don't fragment: Not Set
        ..0 = More fragments: Not Set
    Fragment offset: 0
    Time to live: 64
    Protocol: TCP (0x06)
    Header checksum: 0x74e5 [correct]
        [Good: True]
        [Bad : False]
    Source: 23.1.1.3 (23.1.1.3)
    Destination: 12.1.1.1 (12.1.1.1)
Transmission Control Protocol, Src Port: 59381 (59381), Dst Port: ssh (22), Seq:
 0, Len: 0
    Source port: 59381 (59381)
    Destination port: ssh (22)
    [Stream index: 0]
    Sequence number: 0    (relative sequence number)
    Header length: 40 bytes
    Flags: 0x02 (SYN)
        0... .... = Congestion Window Reduced (CWR): Not set
        .0.. .... = ECN-Echo: Not set
        ..0. .... = Urgent: Not set
        ...0 .... = Acknowledgement: Not set
        .... 0... = Push: Not set
        .... .0.. = Reset: Not set
        .... ..1. = Syn: Set
            [Expert Info (Chat/Sequence): Connection establish request (SYN): se
rver port ssh]
                [Message: Connection establish request (SYN): server port ssh]
                [Severity level: Chat]
                [Group: Sequence]
        .... ...0 = Fin: Not set
    Window size: 16384
    Checksum: 0x8066 [validation disabled]
        [Good Checksum: False]
        [Bad Checksum: False]
    Options: (20 bytes)
        Maximum segment size: 536 bytes
        NOP
        Window scale: 0 (multiply by 1)
        NOP
        NOP
        Timestamps: TSval 184566, TSecr 0

N9K2#

Very well ! Here, we can see detail information similar to what we’d see in Wireshark.

Here are few example of capture filters you can play with. Basically, we’d simply need to replace “host xx.xx.xx.xx” with the below:

Capture Traffic to or from a Range of IP Addresses
net 172.16.7.0/24
net 172.16.7.0 mask 255.255.255.0

Capture Traffic from a Range of IP Addresses
src net 172.16.7.0/24
src net 172.16.7.0 mask 255.255.255.0

Capture Traffic to a Range of IP Addresses
dst net 172.16.7.0/24
dst net 172.16.7.0 mask 255.255.255.0

Capture Traffic Only on a Certain Protocol − Capture Only DNS Traffic
port 53

Capture Traffic Only on a Certain Protocol − Capture Only DHCP Traffic
port 67 or port 68

Capture Traffic Not on a Certain Protocol − Exclude HTTP or SMTP Traffic
host 172.16.7.3 and not port 80 and not port 25

Capture Traffic Not on a Certain Protocol − Exclude ARP and DNS Traffic
port not 53 and not arp

Capture Only IP Traffic − Exclude Lower Layer Protocols like ARP and STP
ip

Capture Only Unicast Traffic − Exclude Broadcast and Multicast Announcements
not broadcast and not multicast

Capture Traffic Within a Range of Layer 4 Ports
tcp portrange 1501−1549

Capture Traffic Based on Ethernet type − Capture EAPOL Traffic
ether proto 0x888e

IPv6 Capture Workaround
ether proto 0x86dd

Capture Traffic Based on IP Protocol Type
ip proto 89

Reject Ethernet Frames Based on MAC Address − Exclude Traffic That Belongs to the LLDP Multicast Group
not ether dst 01:80:c2:00:00:0e

Capture UDLD, VTP, or CDP Traffic
ether host 01:00:0c:cc:cc:cc

Capture Traffic to or from a MAC Address
ether host 00:01:02:03:04:05

Note that you can write much more complex traces but I’ll let you play with the options available. That’s all I have for you today.

Leave a Reply

Your email address will not be published. Required fields are marked *

A Little About Myself

Hello I'm Pape. My friends call me Pop. I'm CCIE #48357. I enjoy my field and love to share it with others. I love to write so I'm sharing my blog with you.

Sign up to receive notifications and updates whenever new topics or videos are uploaded!

RouteLeak Calendar

September 2024
M T W T F S S
 1
2345678
9101112131415
16171819202122
23242526272829
30